分析器
分析器是一个强大的 开发工具,它提供关于任何请求执行的详细信息。
危险
永远不要 在生产环境中启用分析器,因为它会导致项目中的主要安全漏洞。
安装
在使用 Symfony Flex 的应用程序中,运行此命令以安装 profiler Symfony 包,然后再使用它
1
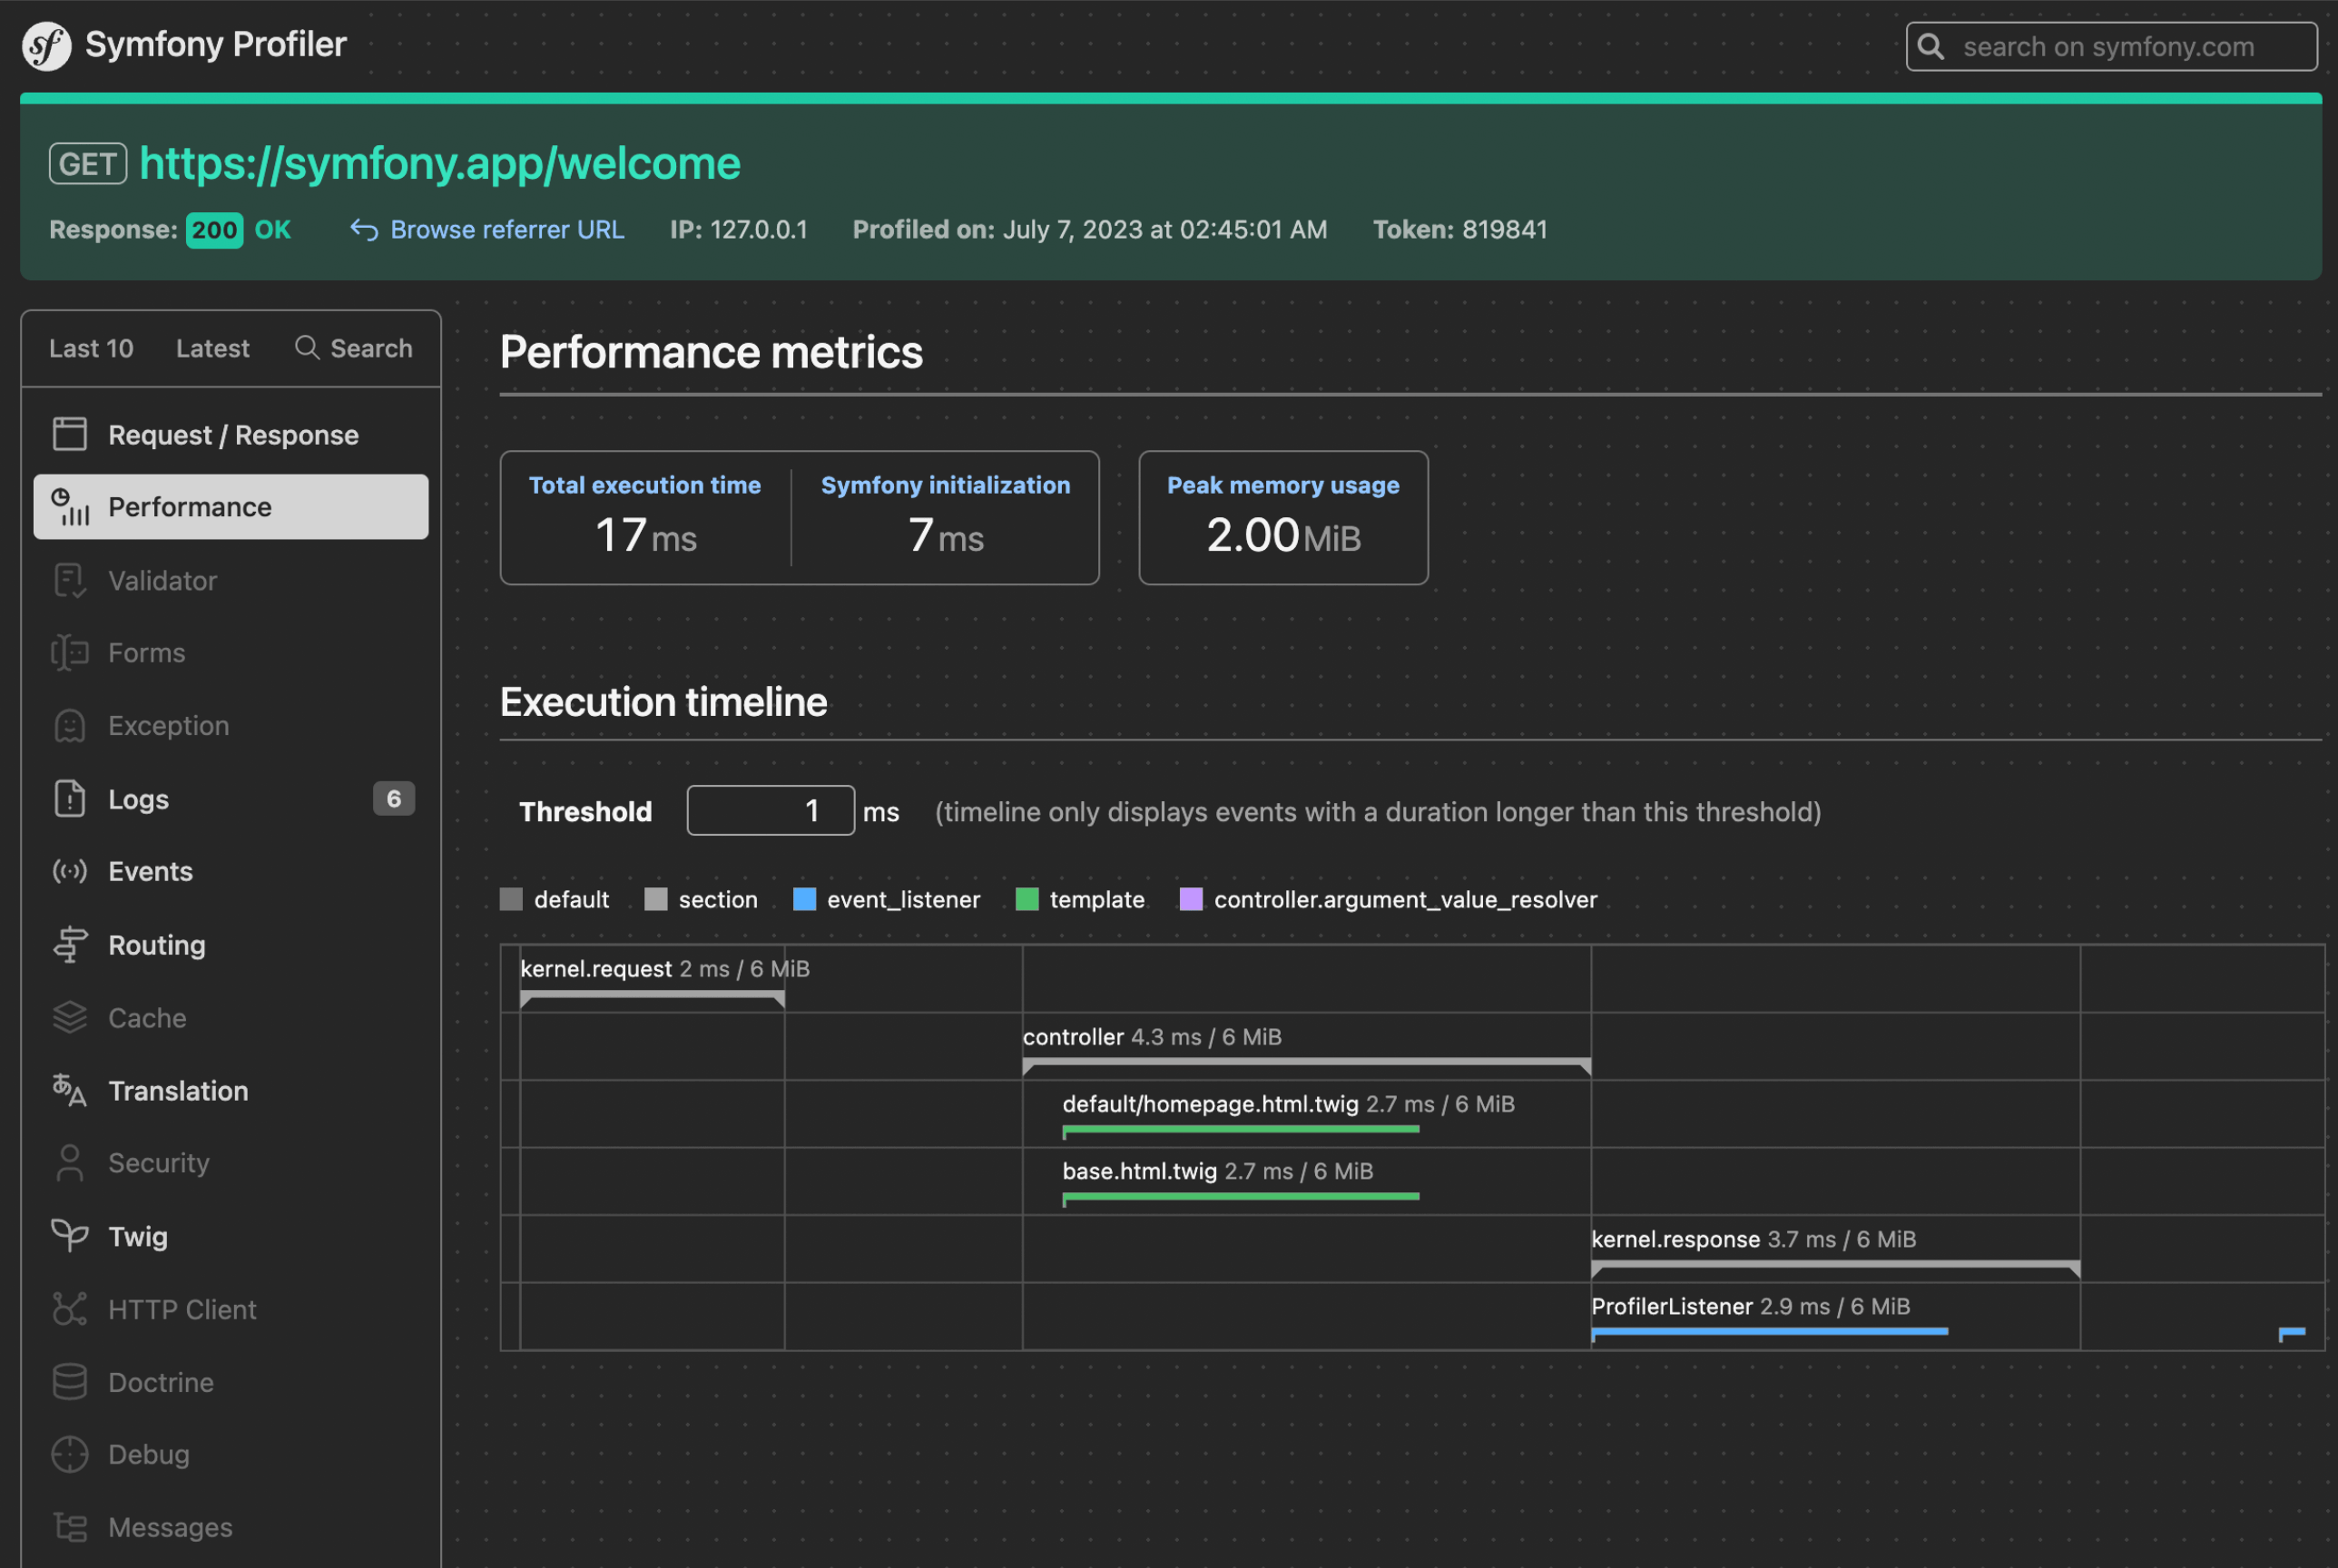
$ composer require --dev symfony/profiler-pack现在,在开发环境中浏览应用程序的任何页面,让分析器收集信息。然后,单击注入到页面底部的调试工具栏的任何元素,以打开 Symfony 分析器的 Web 界面,它看起来像这样
注意
调试工具栏仅注入到 HTML 响应中。对于其他类型的内容(例如 API 请求中的 JSON 响应),分析器 URL 在 X-Debug-Token-Link HTTP 响应头中可用。浏览 /_profiler URL 以查看所有分析信息。
注意
为了限制分析信息在磁盘上使用的存储空间,它们会在 2 天后以概率方式删除。
以编程方式访问分析数据
大多数时候,分析器信息是使用其基于 Web 的界面访问和分析的。但是,您也可以通过 profiler 服务提供的方法以编程方式检索分析信息。
当响应对象可用时,使用 loadProfileFromResponse() 方法来访问与其关联的分析信息
1
2
// ... $profiler is the 'profiler' service
$profile = $profiler->loadProfileFromResponse($response);当分析器存储关于请求的数据时,它也会将其与一个令牌相关联;此令牌在响应的 X-Debug-Token HTTP 头部中可用。使用此令牌,您可以借助 loadProfile() 方法访问任何过去响应的分析信息
1
2
$token = $response->headers->get('X-Debug-Token');
$profile = $profiler->loadProfile($token);
提示
当分析器已启用但 Web 调试工具栏未启用时,请使用浏览器的开发者工具检查页面以获取 X-Debug-Token HTTP 头部的值。
profiler 服务还提供了 find() 方法,用于根据某些条件查找令牌
1
2
3
4
5
6
7
8
9
10
11
12
13
14
// gets the latest 10 tokens
$tokens = $profiler->find('', '', 10, '', '', '');

// gets the latest 10 tokens for all URLs containing /admin/
$tokens = $profiler->find('', '/admin/', 10, '', '', '');

// gets the latest 10 tokens for all URLs not containing /api/
$tokens = $profiler->find('', '!/api/', 10, '', '', '');

// gets the latest 10 tokens for local POST requests
$tokens = $profiler->find('127.0.0.1', '', 10, 'POST', '', '');

// gets the latest 10 tokens for requests that happened between 2 and 4 days ago
$tokens = $profiler->find('', '', 10, '', '4 days ago', '2 days ago');
数据收集器
分析器使用一些称为“数据收集器”的服务来获取其信息。 Symfony 自带了几个收集器,用于获取关于请求、日志记录器、路由、缓存等的信息。
运行此命令以获取应用程序中实际启用的收集器列表
1
$ php bin/console debug:container --tag=data_collector您还可以 创建您自己的数据收集器,以存储应用程序生成的任何数据,并在调试工具栏和分析器 Web 界面中显示它。
定时应用程序的执行
如果您想测量应用程序中某些任务花费的时间,则无需创建自定义数据收集器。而是使用内置实用程序来 分析 Symfony 应用程序。
提示
考虑使用专业的分析器(如 Blackfire)来详细测量和分析应用程序的执行情况。
以编程方式或有条件地启用分析器
Symfony 分析器可以以编程方式启用和禁用。您可以使用控制器中 Profiler 类的 enable() 和 disable() 方法来以编程方式管理分析器
1
2
3
4
5
6
7
8
9
10
11
12
13
14
15
16
17
18
use Symfony\Component\HttpKernel\Profiler\Profiler;
// ...

class DefaultController
{
    // ...

    public function someMethod(?Profiler $profiler): Response
    {
        // $profiler won't be set if your environment doesn't have the profiler (like prod, by default)
        if (null !== $profiler) {
            // if it exists, disable the profiler for this particular controller action
            $profiler->disable();
        }

        // ...
    }
}
为了将分析器注入到您的控制器中,您需要创建一个指向现有 profiler 服务的别名
1
2
3
# config/services_dev.yaml
services:
Symfony\Component\HttpKernel\Profiler\Profiler: '@profiler'有条件地启用分析器
除了像上一节中解释的那样以编程方式启用分析器之外,您还可以在满足特定条件时启用它(例如,URL 中包含某个参数)
1 2 3 4 5
# config/packages/dev/web_profiler.yaml
framework:
profiler:
collect: false
collect_parameter: 'profile'此配置默认禁用分析器 (collect: false) 以提高应用程序性能;但对于包含名为 profile 的查询参数的请求启用它(您可以自由选择此查询参数名称)。
除了查询参数之外,当提交具有该名称的表单字段时(用于在 POST 请求中启用分析器)或将其作为请求属性包含时,此功能也有效。
在 AJAX 请求后更新 Web 调试工具栏
单页应用程序 (SPA) 是 Web 应用程序,它通过动态重写当前页面而不是从服务器加载整个新页面来与用户交互。
默认情况下,调试工具栏显示初始页面加载的信息,并且在每次 AJAX 请求后都不会刷新。但是,您可以将 Symfony-Debug-Toolbar-Replace 标头设置为 '1' 的值,以强制刷新工具栏
1
$response->headers->set('Symfony-Debug-Toolbar-Replace', '1');理想情况下,此标头应仅在开发期间设置,而不应在生产环境中设置。为此,创建一个 事件订阅者 并监听 kernel.response 事件
1 2 3 4 5 6 7 8 9 10 11 12 13 14 15 16 17 18 19 20 21 22 23 24 25 26 27 28 29 30
use Symfony\Component\EventDispatcher\EventSubscriberInterface;
use Symfony\Component\HttpKernel\Event\ResponseEvent;
use Symfony\Component\HttpKernel\KernelInterface;
// ...
class MySubscriber implements EventSubscriberInterface
{
public function __construct(
private KernelInterface $kernel,
) {
}
// ...
public function onKernelResponse(ResponseEvent $event): void
{
if (!$this->kernel->isDebug()) {
return;
}
$request = $event->getRequest();
if (!$request->isXmlHttpRequest()) {
return;
}
$response = $event->getResponse();
$response->headers->set('Symfony-Debug-Toolbar-Replace', '1');
}
}创建数据收集器
Symfony 分析器使用一些称为数据收集器的特殊类来获取其分析和调试信息。 Symfony 捆绑了一些数据收集器,但您也可以创建自己的。
数据收集器是一个 PHP 类,它实现了 DataCollectorInterface。为了方便起见,您的数据收集器也可以从 AbstractDataCollector 类扩展,该类实现了接口并提供了一些实用程序和 $this->data 属性来存储收集的信息。
以下示例显示了一个自定义收集器,它存储关于请求的信息
1 2 3 4 5 6 7 8 9 10 11 12 13 14 15 16 17
// src/DataCollector/RequestCollector.php
namespace App\DataCollector;
use Symfony\Bundle\FrameworkBundle\DataCollector\AbstractDataCollector;
use Symfony\Component\HttpFoundation\Request;
use Symfony\Component\HttpFoundation\Response;
class RequestCollector extends AbstractDataCollector
{
public function collect(Request $request, Response $response, ?\Throwable $exception = null): void
{
$this->data = [
'method' => $request->getMethod(),
'acceptable_content_types' => $request->getAcceptableContentTypes(),
];
}
}以下是您可以在数据收集器类中定义的方法
- collect() 方法
-
将收集的数据存储在本地属性中(如果您从
AbstractDataCollector扩展,则为$this->data)。如果您需要一些服务来收集数据,请将这些服务注入到数据收集器构造函数中。警告
collect()方法只调用一次。它不用于“收集”数据,而是用于“拾取”您的服务已存储的数据。警告
由于分析器序列化数据收集器实例,因此您不应存储无法序列化的对象(如 PDO 对象),或者您需要提供自己的
serialize()方法。 - reset() 方法
- 它在请求之间调用以重置分析器的状态。默认情况下,它只清空
$this->data内容,但您可以覆盖此方法以执行额外的清理。 - getName() 方法
- 返回收集器标识符,该标识符在应用程序中必须是唯一的。默认情况下,它返回数据收集器类的 FQCN,但您可以覆盖此方法以返回自定义名称(例如
app.request_collector)。此值稍后用于访问收集器信息(请参阅 如何在功能测试中使用分析器),因此您可能更喜欢使用短字符串而不是 FQCN 字符串。
collect() 方法在 kernel.response 事件期间调用。如果您需要收集稍后才可用的数据,请实现 LateDataCollectorInterface 并定义 lateCollect() 方法,该方法在分析器数据序列化之前(在 kernel.terminate 事件期间)调用。
注意
如果您使用带有 autoconfigure 的 默认 services.yaml 配置,那么 Symfony 将在下一次页面刷新后开始使用您的数据收集器。否则,手动启用数据收集器。
添加 Web 分析器模板
您的数据收集器收集的信息可以同时在 Web 调试工具栏和 Web 分析器中显示。为此,您需要创建一个包含一些特定块的 Twig 模板。
首先,在您的数据收集器类中添加 getTemplate() 方法,以返回要使用的 Twig 模板的路径。然后,添加一些 getter 以使模板可以访问收集的信息
1 2 3 4 5 6 7 8 9 10 11 12 13 14 15 16 17 18 19 20 21 22 23 24 25 26 27 28 29 30 31
// src/DataCollector/RequestCollector.php
namespace App\DataCollector;
use Symfony\Bundle\FrameworkBundle\DataCollector\AbstractDataCollector;
use Symfony\Component\VarDumper\Cloner\Data;
class RequestCollector extends AbstractDataCollector
{
// ...
public static function getTemplate(): ?string
{
return 'data_collector/template.html.twig';
}
public function getMethod(): string
{
return $this->data['method'];
}
public function getAcceptableContentTypes(): array
{
return $this->data['acceptable_content_types'];
}
public function getSomeObject(): Data
{
// use the cloneVar() method to dump collected data in the profiler
return $this->cloneVar($this->data['method']);
}
}在最简单的情况下,您希望在工具栏中显示信息,而无需提供分析器面板。这需要定义 toolbar 块并设置名为 icon 和 text 的两个变量的值
1 2 3 4 5 6 7 8 9 10 11 12 13 14 15 16 17 18 19 20 21 22 23 24 25 26 27 28
{# templates/data_collector/template.html.twig #}
{% extends '@WebProfiler/Profiler/layout.html.twig' %}
{% block toolbar %}
{% set icon %}
{# this is the content displayed as a panel in the toolbar #}
<svg xmlns="http://www.w3.org/2000/svg"> ... </svg>
<span class="sf-toolbar-value">Request</span>
{% endset %}
{% set text %}
{# this is the content displayed when hovering the mouse over
the toolbar panel #}
<div class="sf-toolbar-info-piece">
<b>Method</b>
<span>{{ collector.method }}</span>
</div>
<div class="sf-toolbar-info-piece">
<b>Accepted content type</b>
<span>{{ collector.acceptableContentTypes|join(', ') }}</span>
</div>
{% endset %}
{# the 'link' value set to 'false' means that this panel doesn't
show a section in the web profiler #}
{{ include('@WebProfiler/Profiler/toolbar_item.html.twig', { link: false }) }}
{% endblock %}提示
Symfony 分析器图标是从 Tabler 图标 中选择的,这是一个大型开源 SVG 图标集合。建议您也为自己的分析器面板使用这些图标,以获得一致的外观。
提示
内置收集器模板将其所有图像定义为嵌入式 SVG 文件。这使得它们可以在任何地方工作,而无需处理 Web 资源链接
1 2 3 4
{% set icon %}
{{ include('data_collector/icon.svg') }}
{# ... #}
{% endset %}如果工具栏面板包含扩展的 Web 分析器信息,则 Twig 模板还必须定义额外的块
1 2 3 4 5 6 7 8 9 10 11 12 13 14 15 16 17 18 19 20 21 22 23 24 25 26 27 28 29 30 31 32 33 34 35 36 37 38 39 40 41 42 43 44 45 46 47 48 49 50
{# templates/data_collector/template.html.twig #}
{% extends '@WebProfiler/Profiler/layout.html.twig' %}
{% block toolbar %}
{% set icon %}
{# ... #}
{% endset %}
{% set text %}
<div class="sf-toolbar-info-piece">
{# ... #}
</div>
{% endset %}
{{ include('@WebProfiler/Profiler/toolbar_item.html.twig', { 'link': true }) }}
{% endblock %}
{% block head %}
{# Optional. Here you can link to or define your own CSS and JS contents. #}
{# Use {{ parent() }} to extend the default styles instead of overriding them. #}
{% endblock %}
{% block menu %}
{# This left-hand menu appears when using the full-screen profiler. #}
<span class="label">
<span class="icon"><img src="..." alt=""/></span>
<strong>Request</strong>
</span>
{% endblock %}
{% block panel %}
{# Optional, for showing the most details. #}
<h2>Acceptable Content Types</h2>
<table>
<tr>
<th>Content Type</th>
</tr>
{% for type in collector.acceptableContentTypes %}
<tr>
<td>{{ type }}</td>
</tr>
{% endfor %}
{# use the profiler_dump() function to render the contents of dumped objects #}
<tr>
{{ profiler_dump(collector.someObject) }}
</tr>
</table>
{% endblock %}menu 和 panel 块是定义与此数据收集器关联的 Web 分析器面板中显示的内容的唯一必需块。所有块都可以访问 collector 对象。
注意
工具栏中每个面板的位置由收集器优先级决定,该优先级只能在 手动配置数据收集器 时定义。
注意
如果您使用带有 autoconfigure 的 默认 services.yaml 配置,那么 Symfony 将在下一次页面刷新后开始在工具栏中显示您的收集器数据。否则,手动启用数据收集器。
启用自定义数据收集器
如果您不使用 Symfony 的带有 自动装配和自动配置 的默认配置,则需要显式配置数据收集器
1 2 3 4 5 6 7 8 9 10 11 12
# config/services.yaml
services:
    App\DataCollector\RequestCollector:
        tags:
            -
                name: data_collector
                # must match the value returned by the getName() method
                id: 'App\DataCollector\RequestCollector'
                # optional template (it has more priority than the value returned by getTemplate())
                template: 'data_collector/template.html.twig'
                # optional priority (positive or negative integer; default = 0)
                # priority: 300